
In last week’s post, we discussed a few Secure Software Development Lifecycle (SSDLC) metrics that I personally find very interesting. The four metrics are:
- The number of qualified defects found per quarter
- The number of qualified defects fixed per quarter
- The difference between [1] and [2], that is, inflow vs outflow
- The overall number of open qualified security defects
In this post, I will share metrics and a graph of the number of qualified security defects that have been fixed, and their development over time. As mentioned in the previous post, the data used to plot the graphs has been anonymized, randomized, and transformed into a relative scale. These transformations are necessary to protect confidential information, but have been performed in a way that does not affect the trends that are typically seen when an SSDLC program is rolled out. All percentages in the graph are relative to the results of the 20 Quarters before the SSDLC program was started.
Number of Qualified Defects Fixed per Quarter
The graph below is a hypothetical metric of the same organization discussed previously, in the same time period. It shows the anonymized and transformed results of the efforts the organization went through to close security defects.
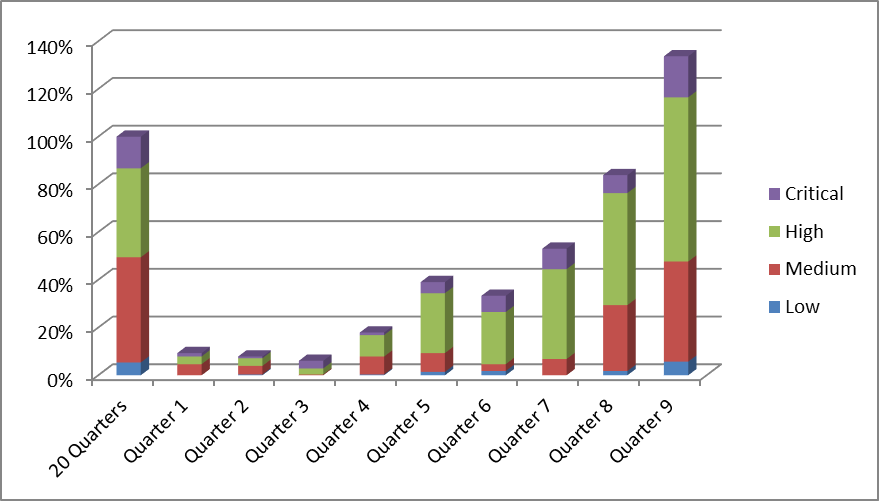
As with the previous graph, we see a slow start. However, once the number of newly discovered defects grow, the fix rates start to go up. There can be many reasons for this behavior. Common reasons for this are typically a combination of buy-in to the program by executive management and buy-in from engineering: In a mature software organization, engineers take responsibility for their deliveries, and create pressure to deal with critical issues rather than delaying them. Often, engineering programs are most successful if both factors are present.
In the organization we use in this example, we see that R&D fixed more (about 35%!) qualified security defects in a single quarter than they did in the previous 5 years, which is an efficiency increase of several thousand percent – and this organization was still in the growing phase during Quarter 9!
Edit: continue reading…