This is the last post in a series of posts where we discussed a few Secure Software Development Lifecycle (SSDLC) metrics that I personally find very interesting. The four metrics are:
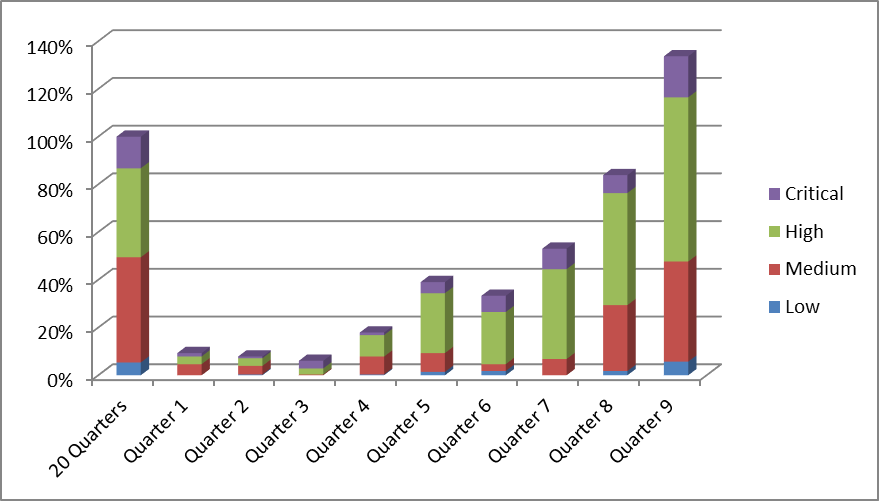
- The number of qualified defects found per quarter
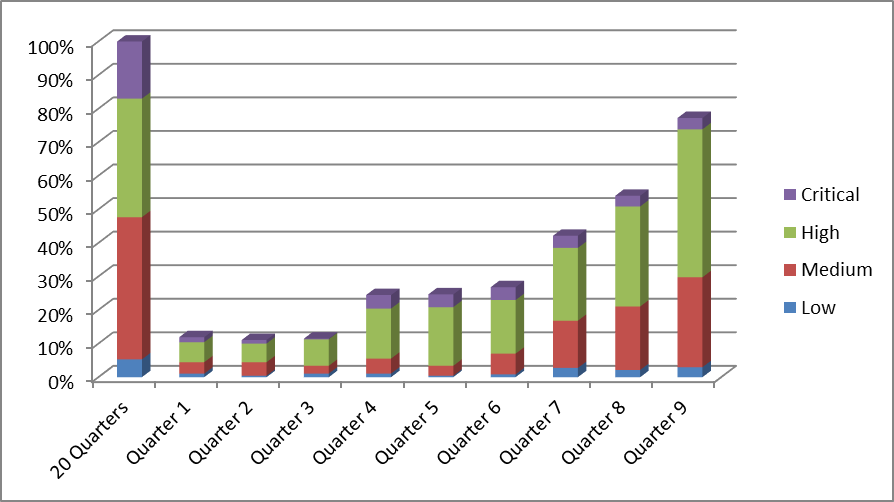
- The number of qualified defects fixed per quarter
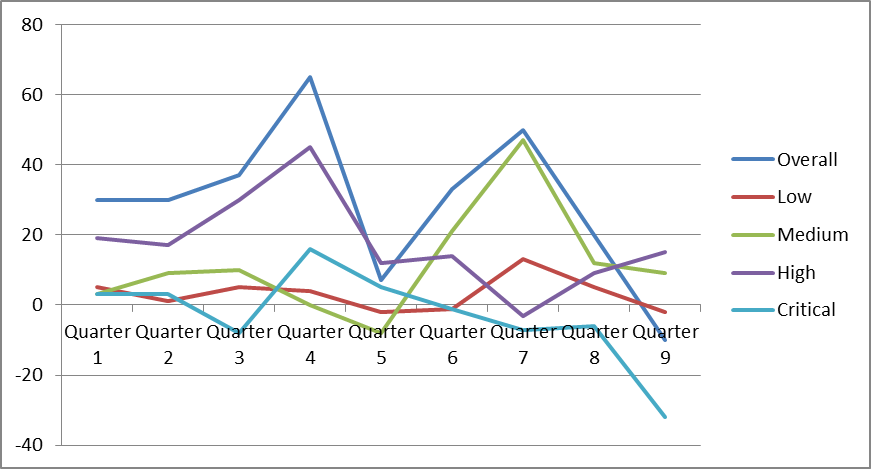
- The difference between [1] and [2], that is, inflow vs outflow
- The overall number of open qualified security defects
In this post, I will share the last metric of the series, which is a graph of the overall number of open qualified security defects, and their development over time. This data is taken from the same organization and product set discussed in the first post of this series, and it has been anonymized, randomized, and transformed into a relative scale to protect confidential information without affecting the trends that are typically seen when starting a new SSDLC program. All percentages in the graph are relative to the results of the 20 Quarters before the SSDLC program was started.
Overall Number of Open Qualified Security Defects
The graph below shows how the overall number of open qualified security defects developed in the example organization. All percentages in the graph are relative to the results of the first 20 Quarters. The organization started out from a backlog of 100% of open issues, and continuously added to that backlog over the following 9 quarters. The backlog peaked at 242% of open issues, and then started to decrease slightly. This means that R&D teams more than doubled their security defects backlog, despite the great increase of fixes they released in the same time, which is a very impressive achievement.
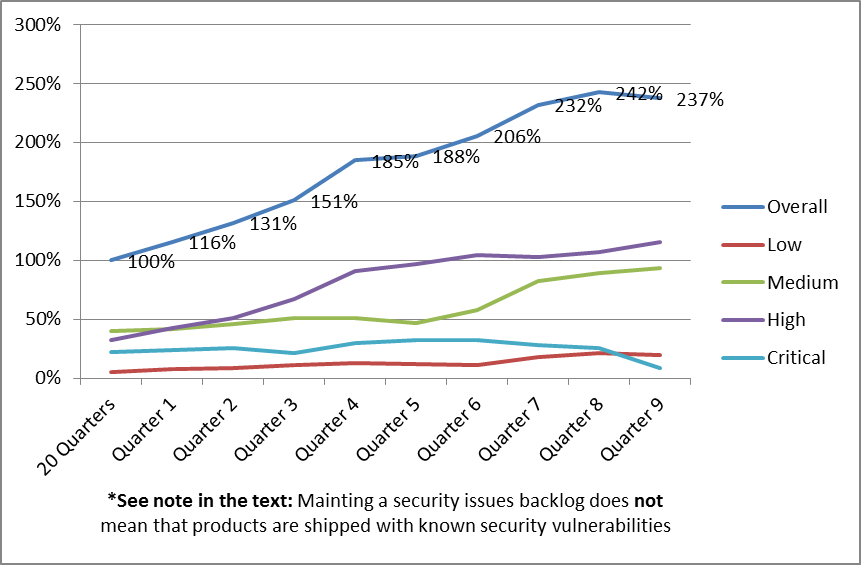
The graph shows that the teams did a good job of keeping the number of critical issues in the backlog consistently low, and even managed to significantly reduce the number of open critical defects in Quarter 9.
We can also see from the graph that in Quarter 9, the teams managed, the first time in more than 7 years (all for which data is available for this organization), to reduce the size of the overall security backlog. This is obviously very much aligned with the inflow/outflow metric, where Quarter 9 shows a negative inflow (or a net outflow) of security issues in the backlog. This is a big achievement, and a good indication that the SSDLC program was solidly embraced by the organization’s senior leadership as well as by the organization’s engineers.
*Important: Note that an organization maintaining a security issues backlog does not necessarily mean that the organization releases products with known security vulnerabilities. Companies such as Hewlett-Packard have strong business ethics, and do their best to protect their customers from all known and unknown security risks. If a security defect in the backlog affects a version or platform that has not yet been released, or may manifest itself as a vulnerability only under certain operating conditions that are not present in supported setups, then a security defect may be backlogged without increasing the security risk for the customer.
For example, a library that is being used in a product may have a defect in input validation, thus leading to a buffer overflow in the library, ultimately affecting the product using the library. The SSDLC process would discover such an issue and track it as a security defect in the backlog. However, the “supported setup” for this library may be that it is only to be used in a product that performs its own input validation before passing any user provided data to the affected library method. As long as the library is being used in this “supported setup”, there is no security vulnerability in the final product, which means that the security defect in the library does not result in a security vulnerability and hence does not translate into a security risk for the customer. Still, the security defect of the library is being tracked in the backlog, so that a fix for the library can be obtained, or the library can be replaced.
Next Steps
One goal of an SSDLC program is to reduce risk and increase confidence that security issues are properly handled. Backed by this confidence in the SSDLC process and the quick turnaround times on security issues an organization will eventually achieve, the leadership team may define new Service Level Agreements (SLAs) for open security issues.
For example, an organization may establish strict SLAs with time windows in which security defects would have to be fixed (issue qualified, defect fixed, patch tested, patch delivered / publicly available). The organization may split this up in a matrix for low / medium / high / critical severity and the source of the defect (internally found / reported by customer under NDA / publicly known). Ideally, the organization should define another metric on how well they delivered against these SLAs, making them true security professionals!