
When discussing Secure Software Development Lifecycle (SSDLC) programs, I get asked a lot whether such an investment is actually worth the effort, or whether it would be better to invest the available resources differently. It is true that running an SSDLC program actively is a big investment, and – as with any business expense – it is very reasonable to evaluate the ROI of these expenses.
As with any engineering program, having solid data is a must when communicating results to upper management. In particular the C-suite of management will request metrics that actually show that the program works as expected.
While there are dozens of metrics that can be collected when executing the SSDLC, I find four metrics particularly interesting. They deal with the inflow and processing of security defects in an organization’s portfolio. Eventually, most “relevant” findings from an SSDLC activity that are actually tracked somewhere (instead of being fixed immediately) are either security defects or security requirements. Security requirement findings are a lot harder to quantify than security defects, because they are bound to a product’s target market, that is, how a product is being used and deployed. Two identical products that are selling to two different target markets may have very different sets of security requirements. For security defects, this is similar to a certain extent. However, a security defect is usually a security defect, and only the severity rating that is attached to it changes with target markets and deployments. This makes security defects a metric which is very easy to quantify and compare.
The four metrics we will discuss in the following are:
- The number of qualified defects found per quarter
- The number of qualified defects fixed per quarter
- The difference between [1] and [2], that is, inflow vs outflow
- The overall number of open qualified security defects
During my tenure at HP, I helped several organizations within HP introduce and successfully run SSDLC programs. Such organizations in HP may be business units or groups of product teams. The data provided in this series of posts is constructed based on data I collected from an R&D organization in HP with a few hundred R&D engineers. For obvious reasons, I cannot reveal from which exact organization and what exact product set the data was derived from. To maintain additional confidentiality, I took data that is several years old and not current, changed the numbers in a way that would not change the overall pattern, and then transformed it into a relative scale. These transformations do not affected the trends in the graph, which makes the anonymized (and somewhat randomized) data good enough for this series of posts.
Number of Qualified Defects Found Per Quarter
The figure below shows the number of issues found per quarter over a time period of 10 (i.e. 9 plus 1) quarters, broken up into low, medium, high, and critical severity defects: this particular organization had a history of 20 quarters of security activities. All the results that were achieved in these 5 years are represented in the “20 Quarters” bar. The bars for Quarter 1 to Quarter 9 represent data points after the organization decided to introduce an SSDLC program. Note that all data points are relative to the results of the first 20 Quarters, as the absolute numbers are confidential and cannot be published.
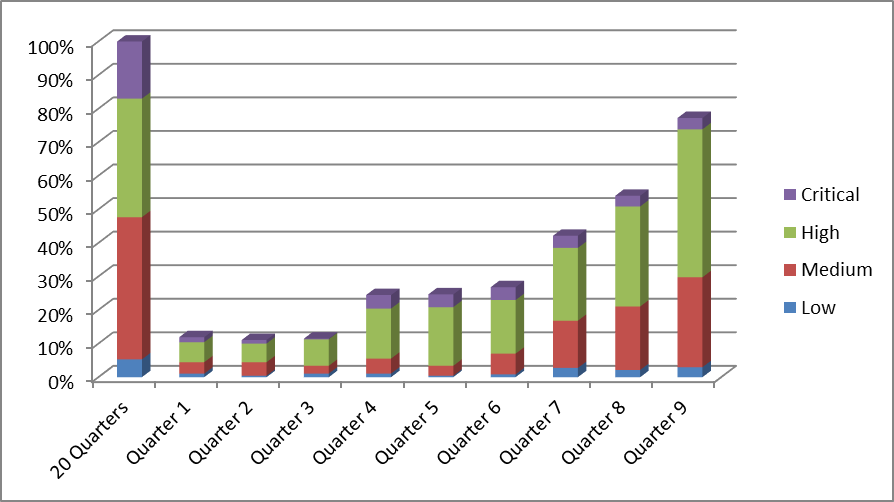
The graph shows that the program started slowly, with the number of newly reported security defects per quarter being in the 10% range of the previous 20 Quarters. Then it gained traction, roughly doubling this number to about 25% per quarter relative to what was reported in the overall 20 Quarters before the program was initiated. After Quarter 7, the program really took off, and started to show fast growth on newly discovered defects.
This is a very typical pattern. Depending on the size of the organization, it usually takes 6 to 9 months after real activities (i.e. more than Powerpoint activities) have started to see any significant results. Once a few big teams or lighthouse projects within the organization are fully on board, and see the first encouraging results for their projects, managers start investing more resources and engineers start to develop a higher level of security awareness. At this point, we often see an exponential growth until a saturation level is reached, and then a slight decline to a stable level.
In this particular example, we see that this organization (which at the time was still in the growing phase) managed to find almost as many (about 75%) qualified security defects in a single quarter than they did in the previous 5 years.
Edit: continue reading…